The hell of CPU debugging
This article aims to give an overview of my project named
bracoujl, a script I made when writing and debugging my GameBoy color emulator project. Both projects’ code are available on my bitbucket: the emulator (nebula) and the debugging tool (bracoujl).
Tip: If a graph in this blog post is big, browser will not make it easy to move arround to inspect it. For this,
eogis cool. It has zoom and drag-and-drop movement features.
Is writing an emulator for the GameBoy easy? Well I did not think it would take me that kind of debug to do so, but I think this is an interesting story.
While starting it, I decided I wanted it to be clean. If you read this nice chart containing all the opcodes of the CPU, you can see patterns. Cool! This means we have an opportunity to factorize the code! The most important thing I learnt about emulation: the CPU is the easiest thing to write and understand, but the easiest to screw too, and even if it’s not directly the CPU that fails, it will probably be impacted. (memory, anyone?)
With bracoujl, the goal was to get a better idea of what the CPU was
doing, to understand bugs easier. This blog post will present what bracoujl
can understand, and then show examples of debugging done with it.
Beginning with CPU debugging
When starting to debug my emulator, so basically watching what was being executed, I first started with the awesome ROMs written by blargg. It was cool and helped a lot, but one thing really hit me fast: if you don’t really know where the bug is, stepping through the code becomes boring really, really, really quickly.
Most of the ROMs I worked with start with a lot of memory initialization and the simple process of extracting some code or data from somewhere in memory to somewhere else (ROM to RAM for example). Check the function bellow for example. It comes from the bomberman ROM.
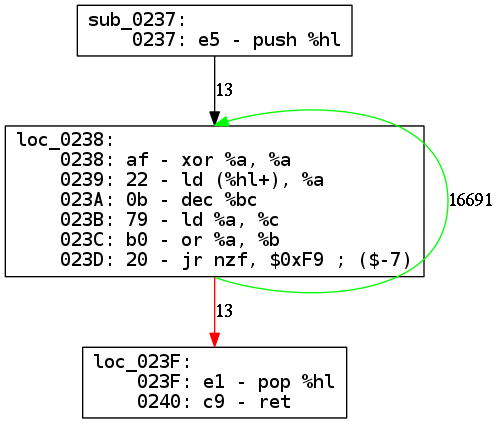
This function is small and called 13 times, but the loop is executed 16691 times which represents over 100k instructions linearly. And this is only a small function, when debugging a bug caused by the joypad, I used to generate logs containing millions of instructions executed.
[DEBUG] PC: 0100 | OPCODE: 00 | MEM: C350 | DIS: nop
[DEBUG] PC: 0101 | OPCODE: C3 | MEM: 5001 | DIS: jmp $0x0150
[DEBUG] PC: 0150 | OPCODE: F0 | MEM: 44FE | DIS: ldh %a, ($0xFF44)
[DEBUG] PC: 0152 | OPCODE: FE | MEM: 9138 | DIS: cp %a, $0x91
[DEBUG] PC: 0154 | OPCODE: 38 | MEM: FAAF | DIS: jr cy, $0xFA ; ($-6)
[DEBUG] PC: 0150 | OPCODE: F0 | MEM: 44FE | DIS: ldh %a, ($0xFF44)
[DEBUG] PC: 0152 | OPCODE: FE | MEM: 9138 | DIS: cp %a, $0x91
[DEBUG] PC: 0154 | OPCODE: 38 | MEM: FAAF | DIS: jr cy, $0xFA ; ($-6)
[DEBUG] PC: 0150 | OPCODE: F0 | MEM: 44FE | DIS: ldh %a, ($0xFF44)
[DEBUG] PC: 0152 | OPCODE: FE | MEM: 9138 | DIS: cp %a, $0x91
[DEBUG] PC: 0154 | OPCODE: 38 | MEM: FAAF | DIS: jr cy, $0xFA ; ($-6)
[DEBUG] PC: 0150 | OPCODE: F0 | MEM: 44FE | DIS: ldh %a, ($0xFF44)
[DEBUG] PC: 0152 | OPCODE: FE | MEM: 9138 | DIS: cp %a, $0x91
[DEBUG] PC: 0154 | OPCODE: 38 | MEM: FAAF | DIS: jr cy, $0xFA ; ($-6)
[DEBUG] PC: 0150 | OPCODE: F0 | MEM: 44FE | DIS: ldh %a, ($0xFF44)
[DEBUG] PC: 0152 | OPCODE: FE | MEM: 9138 | DIS: cp %a, $0x91
[DEBUG] PC: 0154 | OPCODE: 38 | MEM: FAAF | DIS: jr cy, $0xFA ; ($-6)
[DEBUG] PC: 0150 | OPCODE: F0 | MEM: 44FE | DIS: ldh %a, ($0xFF44)
[DEBUG] PC: 0152 | OPCODE: FE | MEM: 9138 | DIS: cp %a, $0x91
[DEBUG] PC: 0154 | OPCODE: 38 | MEM: FAAF | DIS: jr cy, $0xFA ; ($-6)
This is the input of bracoujl. This input format is defined by the CPU
configuration used. DIS was added by a miscellaneous script (bundled with
bracoujl) for your convenience, but it is not in the original logs.
This is only the first problem, because while executing this, you must save all the calling backtrace, and follow in which loop you are in (without forgetting nested loops). Additionally, once you have interruptions implemented, they will start randomly, so you must remember what you were looking at and context switch in your head too, for it.
I must be honnest, I did not really check what other people did on the subject. I thought of this as an interesting problem and wanted to solve it myself. Here are the solutions I weighted:
- I was in C++, so simply debug the CPU through my C++ code in
gdb. - Write a simple debugger for the
z80CPU, with memory/register dumps and breakpoint management. - Write a tool to transform logs of the linear execution of a ROM into something useful.
The first approach is OK for me if you know what you want to debug. Say find out what contains memory for a certain instruction. But it starts to be as boring as steping through the instructions when you don’t know what you want to find.
I did not take the second approach for a simple reason: the support of this is too complicated. With a gameboy emulator, having another working emulator at hand with sources is easy, and it helps a lot to be able to compare behaviors. It helps a lot to understand the inner-workings of this type of hardware, but if you implement a debugger in yours, you must do it for your reference too, which is not practical.
Writing a debugger brings easy bugs with it too, or it could be fooled by the current bugs of the CPU itself. Instead, only having to print the current program counter, and the instruction opcode on stdout is easy, doesn’t require to understand the whole CPU and memory architecture for a given emulator and avoids making mistakes.
It is in my plans to write the debugger for the z80 for nebula. My point is
that it is not a good solution when the CPU is totally broken. Finally, the last
solution is re-usable. If you currently write an emulator, you should be able to
try it with a really small patch in your code.
What bracoujl can understand (to an extent)
So the solution was to automate the process of transforming of the linear logs
to graphs, generated with graphviz via a dot file. The visual form of
functions is a lot better than instructions on a linear way.
This part will explain what bracoujl understands and why it matters regarding
our problem. Titles should give you a nice idea of all the problems I
encountered while solving them.
I think you must first understand how bracoujl proceeds. The base of the
algorithm is as follow:
- For each instruction that was executed. We have
pc(program counter),opcode(a byte being the opcode) and, in the case of thez80, two bytes of memory following the opcode for the disassembler, that could be skipped if there was no disassembler.- Check the
pcin our current graph. We store theopcodeat thatpcas an instruction and link it to the last instruction executed. - Only the link step is necessary if we already knew the instruction.
- If we already knew the link too, nothing has to be done to construct a graph.
- Check the
- When we read all the instructions, we can now remove all the links between two instructions where the starting instruction doesn’t go anywhere else and the ending instruction isn’t reached by any other instruction. This creates blocks.
- Once all the blocks are created, we just need to output all those as a
dotfile and then use them to generate the image files necessary.
But this will generate big, un-readable graphs that cannot be used easily. Here
are a series of fixes that bracoujl does and that enhance the readability of
the graphs.
Graph readability and size
(Conditional) Jumps
Lets start with a first, little fix that enhances readability quite a lot. The
first fix I decided to do is to cut any block if it ends on a jump. This is done
easily through the CPU configuration used by bracoujl.
All that was needed is a list of jumps, relative jumps and the cutting was easy. But something makes the graph a lot more readable: colorize the links on conditional jumps, in green when it is taken, in red when it is not triggered.
This is simple if we know the size of a given jump. When retrieving the next instruction, we can know if it is the instruction behind the jump in memory (which means we fell-through) or another address, in which case we decide we took the jump.
The result can be seen in above graph of the function sub_0237 with the loop
that uses a relative jump of -7 bytes if %b | %c is not zero (%bc is not
zero). When the relative jump is taken, we go back at the beginning of the loop
(green link), else we continue to the end of the function (red link).
Functions
First thing done to enhance readability, was to understand when a call was made,
and when it returns, and to continue building from the call opcode on ret.
For instance, take this simple x86_64 assembly code:
func:
    push rbx
    xor rbx, rbx
    mov [rax], rbx
    pop rbx
    ret

main:
    mov rax, 0xcafebabedeadbeef
    call func
    xor rax, rax
    inc rax
    ret
Seen linearly, it looks like this log:
mov rax, 0xcafebabedeadbeef
call func
push rbx
xor rbx, rbx
mov [rax], rbx
pop rbx
ret
xor rax, rax
inc rax
ret
But when drawing the graph, you don’t really want to have a ret linked to the
xor rax, rax, so the goal was to understand the ret instruction and to go
back to the call instruction. This is done easily with a back-trace list of
addresses, the list of call and rst (interrupt call) instructions.
But z80 has both conditional call and ret instructions. So the process of
understanding if one of these instructions triggered is done the same way than
what is done for jump instructions, explained above.
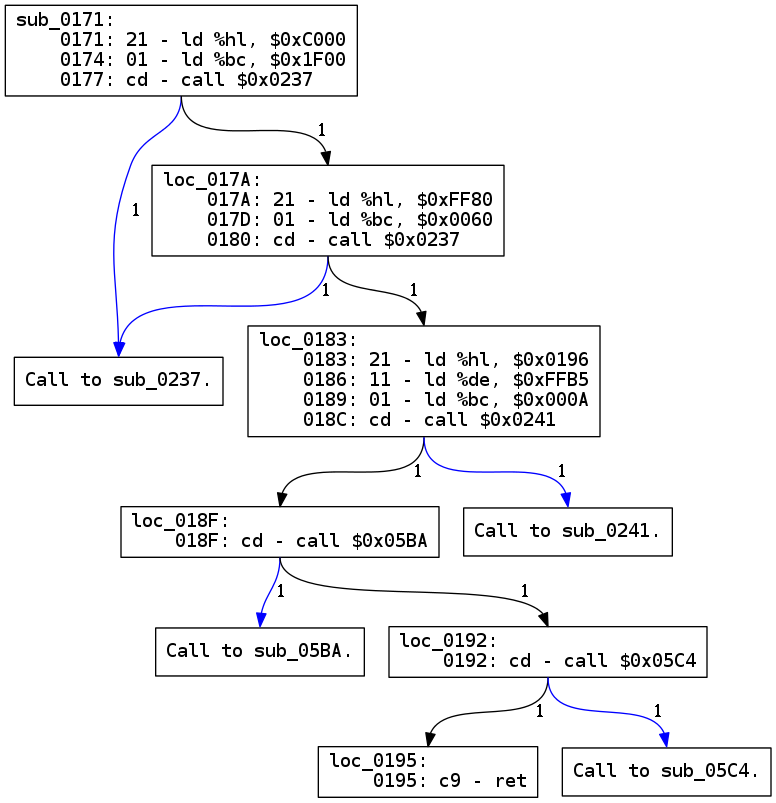
When starting the project, call links would also be colorized, but in blue. The problem is, graphs became bigger and bigger. And if a function was called in a lot of places, it became a hot-spot of the graph. Below is an example of an old version, not too huge, that shows the readability problem of having all functions in one graph.

Now only bigger functions look like this, and all calls are replaced with little
boxes only saying Call to sub_XXXX. The next graph shows a function with some
calls, that looks a lot cleaner now that the functions are split.
Interrupts
Another problem are the interruptions done by the CPU. They will start “randomly” between the instructions. The problem is, it breaks a lot of blocks in pieces, and this is annoying. The important thing to understand is that, even if the first execution of the function is broken only in one place, the more it is called, the more it will be broken, and often in a lot of different places.
This example (I crafted by hand) shows the kind of graphs you would get with
only the function sub_0237 above and the interrupts not removed out of the
way.
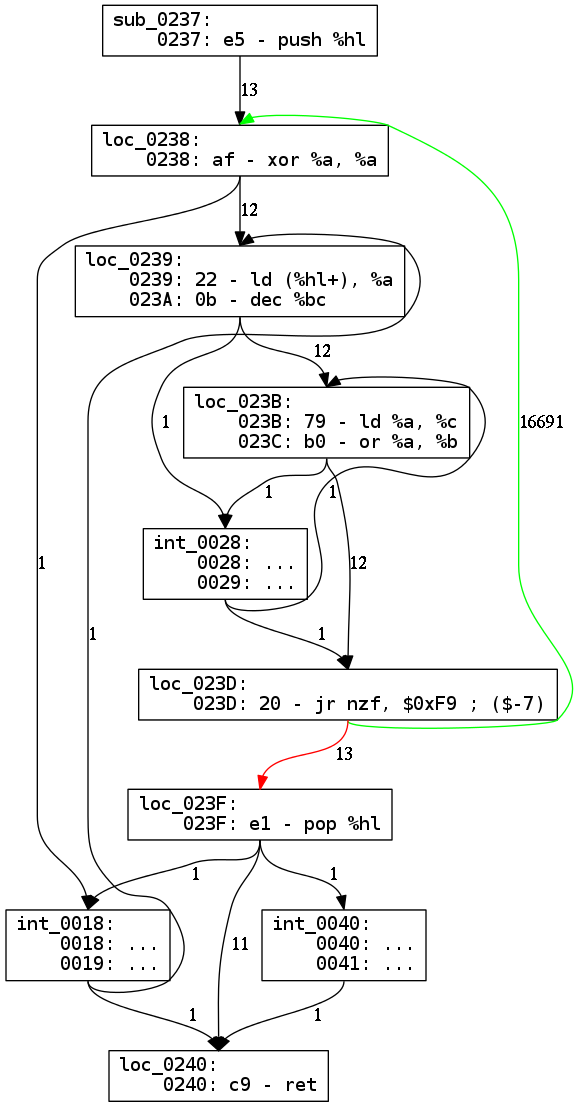
As you can see, the little function above is now a complicated cluster of nodes
with links crossed everywhere. The end result looks a lot like function cutting,
but for detection, this time I used the fact that all interrupts have know
addresses (in practice a jump table located from address 0000h to address
0060h every 8 bytes).
There is another way to trigger an interrupt, and this is with the rst
instruction. Now this is not a problem, in fact this is managed the exact same
way a call is managed. Both methods use the same algorithm than calls for the
back-trace, and the way conditional returns are managed.
Other behaviors
Now we have ok looking graphs of the program being executed. A lot more readable than only the linear logs of execution. But there are still other things done by a ROM that are disturbing, and must be understood.
Memory changes
This problem can come if there is self-modifying code, virtual memory or, like in the GameBoy, memory banking.
Memory banking by example
The first 4000h addresses of the address space on the GameBoy are the first
4000h bytes of the ROM, we will call ROM Bank 0. This only gives 16 KB of
space for the ROM in the address space, for all game code and data. This is
small, so the next 4000h addresses (from 4000h to 7FFFh) are a view of
another 16 KB of the ROM. It is a switchable view of ROM banks. So the GameBoy
can address 32 KB of ROM memory at the same time.
This memory is not writable, so when writing to this address space, it switches the current memory viewed by the switchable memory bank. There are several memory controllers that can be used, documentation can be found there.
Lets take an example with MBC1 memory bank controller. Say we currently are on
bank 2, which is 8000h:BFFFh of the ROM viewed through 4000h:7FFFh of the
address space. If the code writes value 05h on any address of 2000h:3FFFh,
this will change the lower 5 bits of the current ROM selector with the lower 5
bits of the value, which will make us view fifth bank in this case. We now use
14000h:17FFFh of the ROM when addressing 4000h:7FFFh of the address space.
This system makes it possible to address up to 2 MB of ROM memory, instead of 16
KB.
Memory changes management
All this speech to say what? That whenever any code is executed in memory range
4000h:7FFFh, it can be up to 125 different functions if MBC1 is used, and it
happens. This would be the same problem if the code was in memory and changed
itself.
To manage this, bracoujl compares the instruction executed with the instructions
known for this address. If they are different, it creates different paths from
the preceding instruction. Sometimes they merge back with the old flow,
sometimes they just totally differ. It often happens for a function that is
called and is switched, or the target of a jump.
The blocks are then merged and split as usual, and same-memory blocks are named with a memory label, that is the order in which they were gone through.
This is kind of a proof-of-concept management algorithm, it sadly doesn’t give
any insight in the timeline of the memory changes. Even though I didn’t see it
become chaotic, I think it could, which is not cool. Anyway, with this feature,
bracoujl is not disturbed if the code changes for a same memory address.
push + ret = jump
Another behavior used by some games is to do a push of an address, then a
ret and so effectively doing a jump. This used to break completely the
back-trace of calls and interrupts.
To fix this, the concept of “ret miss” was introduced. bracoujl checks for the
address of the next instruction after a ret against the expected address
(computed from the size of call opcodes). If they don’t correspond, this means
there was a weird manipulation of the stack done, and is understood as a “ret
miss”.
Sometimes this is just because there is a bug in memory or CPU, but in cases like the below function, it is stack manipulation.
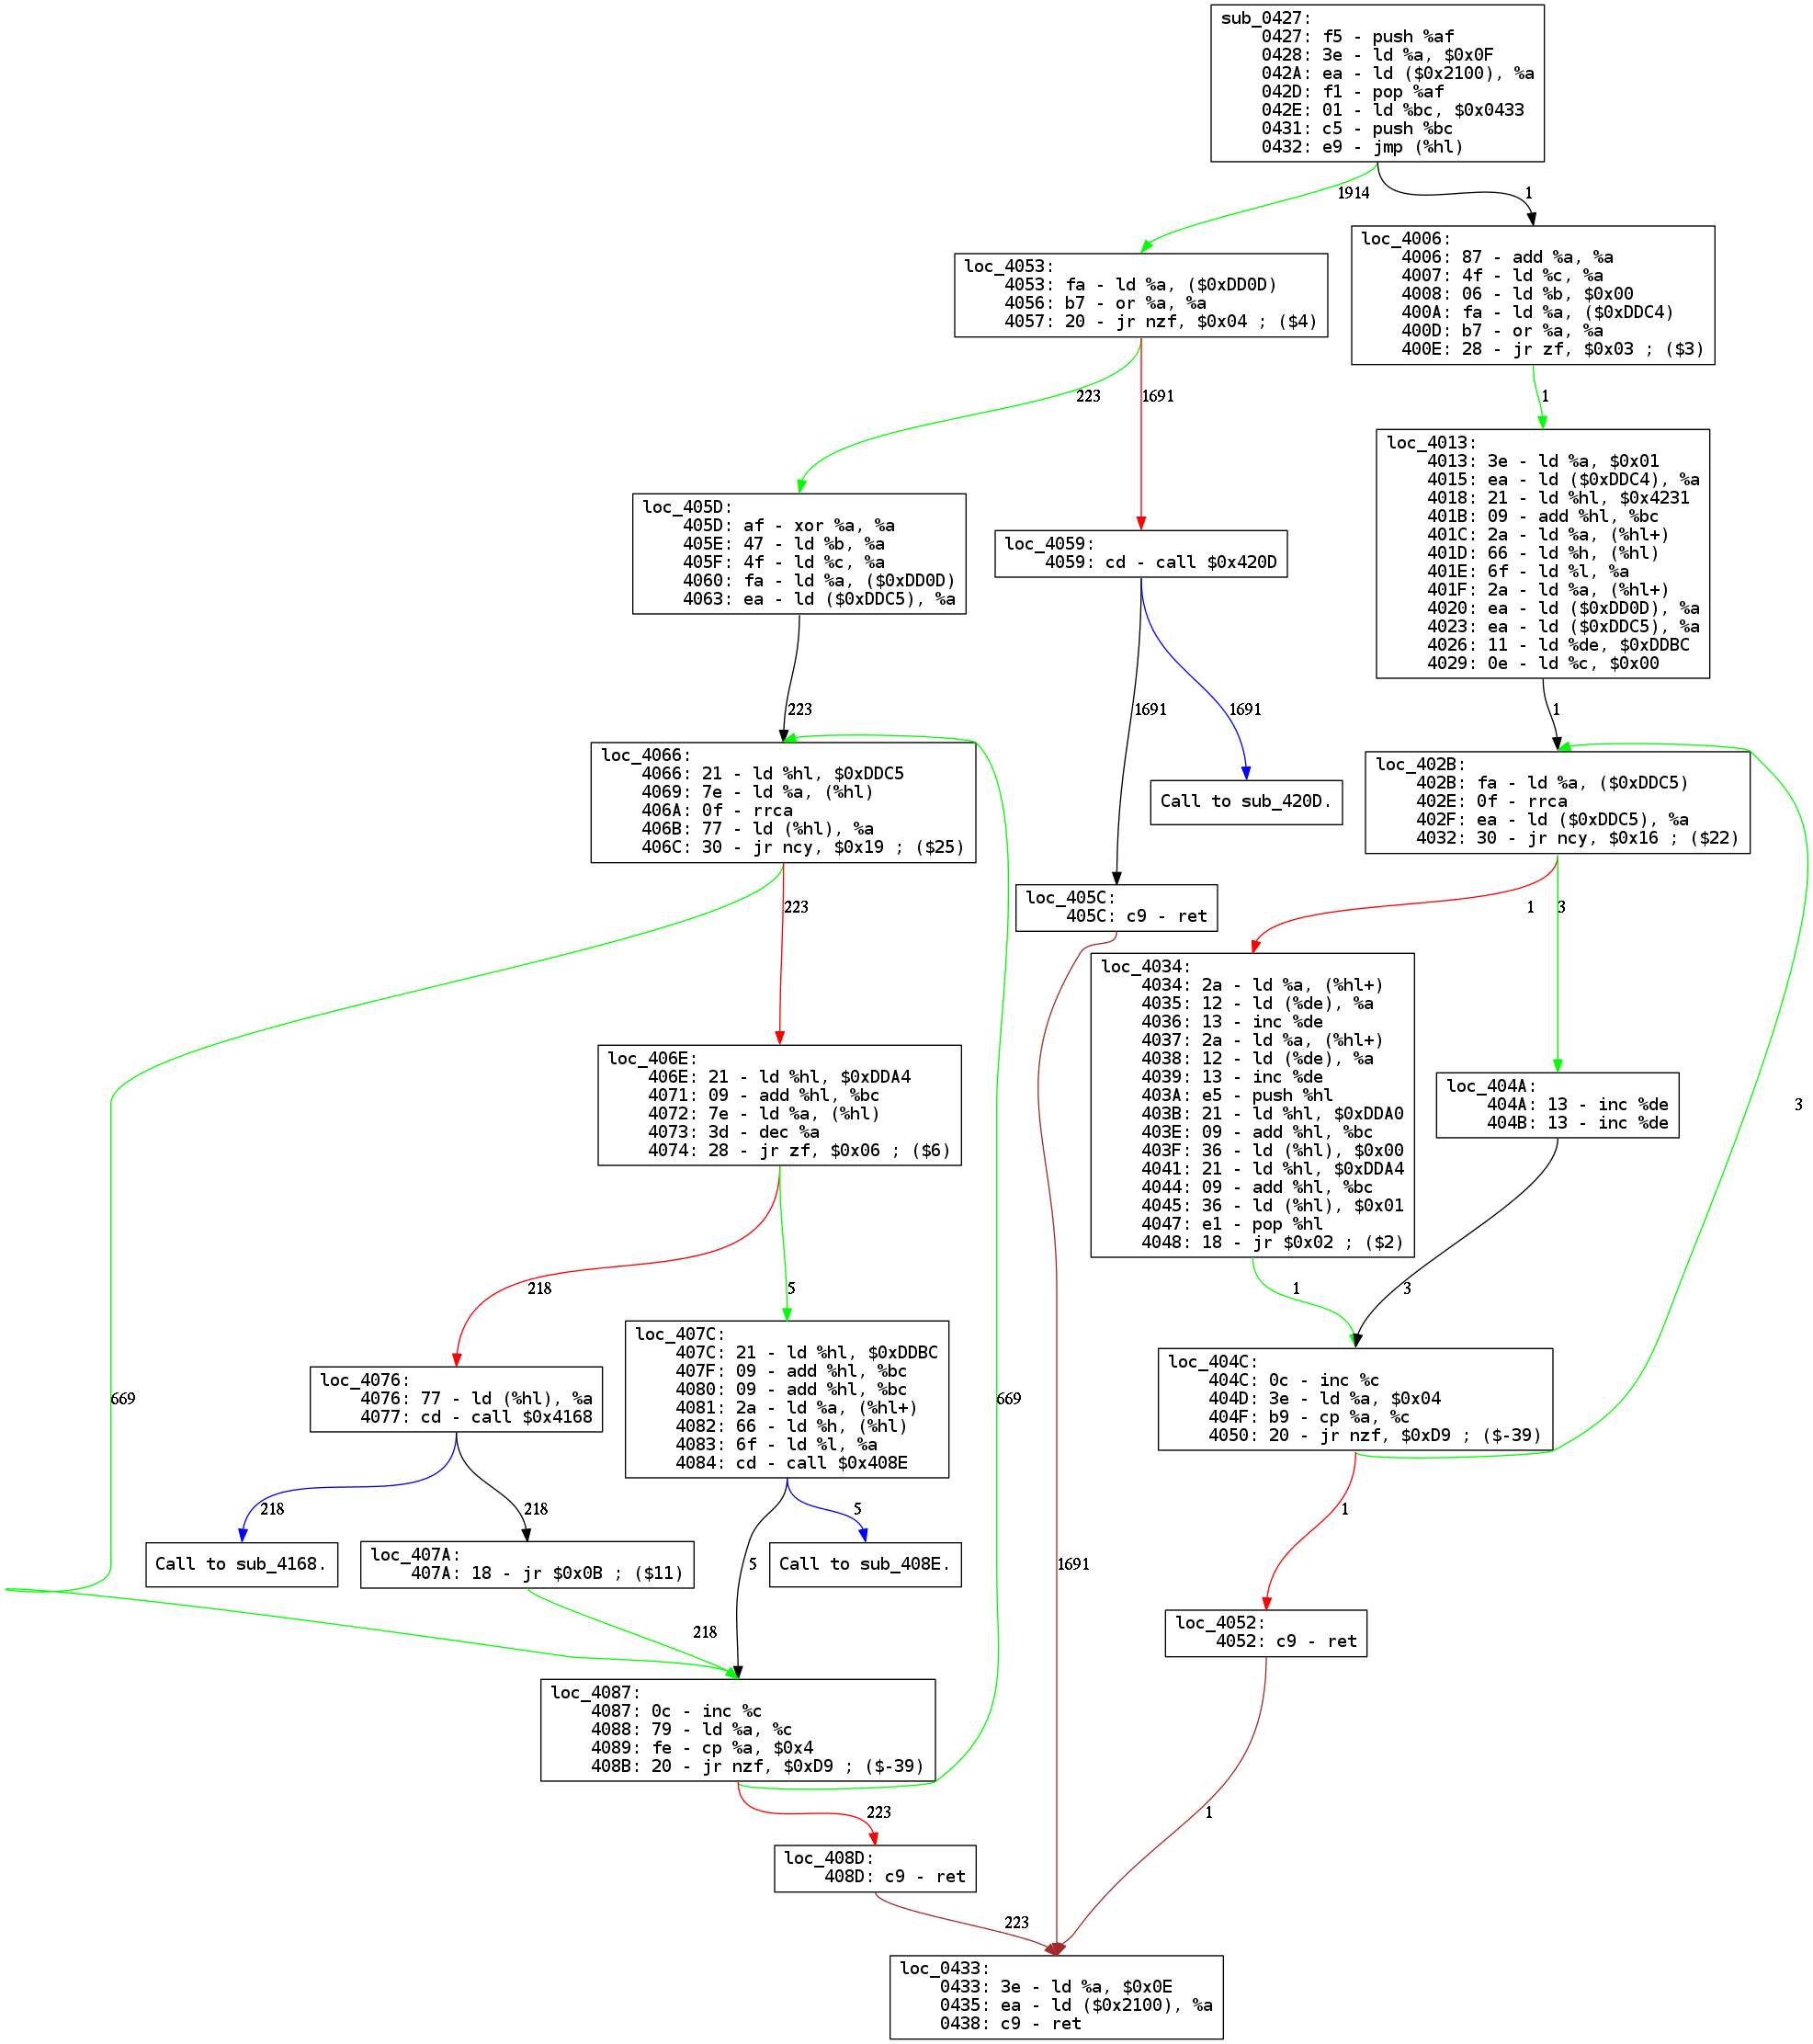
If you look at the three local blocks named loc_4052, loc_405C and
loc_408D. They all go to block loc_0433 and are considered ret misses (brown
link). This can be explained by the first block of the function, sub_0427,
where we can read ld %bc, $0x0433; push %bc. Since the jump instruction uses
%hl register and jumps to switchable ROM banks from ROM bank 0, it was
probably the easiest way to go back to the right code in bank 0 without
hard-coding any address in rom banks.
As you can see with this example, this method keeps the graph readable and simple, and reading it explains the behavior easily, which is cool.
Other features
Graph comparison
This feature aims to compare two graphs produced by two different flows (from two different emulators, or two different versions of the same emulator) against each other. Once the graph are produced, they should look a lot alike for a given code.
Number of loops (on synchronization mechanisms) and interrupts can vary a lot
between the two emulators. Even more if both are not perfect emulators. This is
why linear comparison with diff or meld is impossible. Plus files are
usually huge, for not that much code.
The output currently is fairly simple, but it at least lists the function where it found different blocks and list all the different blocks. Differences currently include:
- A block that reaches more places in one of the graphs.
- A block that is reached from more places in one of the graphs.
- A block that is present in only one of the graphs.
- A block is different in graphs. Which can be caused by:
- A block that was not split in two, because one of its inner instructions was reached once, instead of from multiple other blocks.
- The CPU gets the size of an instruction wrong and started to execute some wrong code.
Disassenbly
Finally, one last choice was to put the optional disassembler directly in
bracoujl instead of expecting the emulator to do it. The biggest argument
being that then you can compare logs from multiple emulators containing
disassembly at no cost.
Case studies
Here are some examples of graphs that really show how much it can help identify bugs. In all these examples, the left image will be the expected behavior, and the right one will be the buggy behavior.
For the simple case studies, the graphs are given with a patch to add the bug
to nebula, from commit number b3b72f3 and both logs are from nebula. I indeed
added those bugs intentionally to show the graph, but if you go through the
commit log, you should find those same bugs when I fixed them. The big case
studies are made directly with the fixed commits, referenced in the
explanations.
Simple case studies
Multi-byte instruction with wrong size


diff --git a/src/z80/z80opcodes.cc b/src/z80/z80opcodes.cc
index 8c9ed8e..55b1a49 100644
--- a/src/z80/z80opcodes.cc
+++ b/src/z80/z80opcodes.cc
@@ -61,7 +61,7 @@ uint16_t ld_1B_reg_d8(MMU& mmu, Z80Registers& regs, uint8_t& reg)
 uint16_t ld_2B_reg_d16(MMU& mmu, Z80Registers& regs, WordRegProxy& reg)
 {
     reg.set(mmu.read<uint16_t>(regs.PC + 1));
-    return P(3, 12);
+    return P(2, 12);
 }

 uint16_t ld_2B_reg_d16(MMU& mmu, Z80Registers& regs, uint16_t& reg)
This first example was a little modified so that second image is not too big
(this should be fixed quite soon in bracoujl, since I consider this an
undesired behavior). Anyway, as you should clearly see, there are additional
instructions in second and third blocks. Then later instead of a jump, the CPU
goes into irrelevant code that ends up being mostly nops, and this loops
endlessly.
This bug was also observed with the CPU starting to execute a part of the memory containing data or not aligned properly on code and then stopping on an undefined instruction.
Relative jump mis-behaving

diff --git a/src/z80/z80opcodes.cc b/src/z80/z80opcodes.cc
index 8c9ed8e..964394e 100644
--- a/src/z80/z80opcodes.cc
+++ b/src/z80/z80opcodes.cc
@@ -408,7 +408,7 @@ uint16_t jr_if(MMU& mmu, Z80Registers& regs, uint8_t val)
     if (val)
     {
         regs.PC += (int8_t) mmu.read<uint8_t>(regs.PC + 1);
-        return P(2, 12);
+        return P(0, 12);
     }
     return P(2, 8);
 }
This mistake I made on relative jump is computing the target address without counting jump instruction size. The graph makes it really clear that some instructions are not executed. Again this example is an easy one that could have been avoided.
Flags not set correctly
If you don’t have test ROMs as I did for the GameBoy, you can also check for flag consistency with the number of loops you execute. Say one instruction sets the flag triggering a relative jump instruction for a loop one value too soon, then you have one iteration of a loop that is not executed, that can be seen in a graph too. But lets go into more interesting bugs.
Case study: Is joypad OK?
This bug was in nebula up until commit 9859ef3 (included). In addition to
looking nice, this the kind of bug that bracoujl is made for. When starting to
debug, the two usual questions must be answered:
- Where is the bug?
- What is causing the bug?
My understanding at the time was that to function properly, the minimum necessary to a game was the CPU, the memory and the GPU. Sound and joypad were optional. We could guess that this bug must come from the GPU, but once the first frame is displayed correctly, the game continues correctly, weird.
So lets try to use bracoujl on this. I had another emulator at the time, and I
made the stats with this when I was really debugging it, but the following stats
are from nebula (9859ef3 for the buggy stats, b3b72f3 for the good ones).
When trying to stop on the first valid frame as soon as possible on both, the
correctly working emulator was able to display the first frame with a few
letters in 320,138 instructions (13 MB of logs), while for the buggy version,
2,938,046 instructions were necessary to get to the first frame (118 MB of
logs), before the first letter could even be displayed. This is interesting,
the CPU really is impacted heavily here. We are not going to read this by hand.
So lets put bracoujl in use.
When looking at the graphs (or using the comparison function), the first
difference is in the function sub_0819.


Hmmm this is weird: FF00h is an I/O Port to … the JOYPAD status. I
honestly could not believe this could be a problem. We also noticed that
interrupts were triggered totally differently in the two emulators we had, and
I thought this was probably more relevant to the problem.
Since we were two to work on nebula during that time and I knew I had done a
shitty job at implementing the joypad, we decided to split jobs: my friend
colona would fix the joypad while I would continue to analyze the logs for
interesting stuff.
Turns out that once he came back to me with a patch for the joypad, he also
fixed the bug with it. Bomberman apparently has a weird behavior if the JOYPAD
is not in the state it expects it to be in. Thanks again to Ivan Delalande
(colona) for his awesome help on this bug.
I think the lesson learnt with this bug was that trying to explain the bug with a complicated explanation when an obvious issue was there was wrong. Instead, starting by fixing simple issues before reaching for more complicated explanations is a good idea in a program like that.
Case study: Memory banks rock!
Often, bracoujl is an helper with another method. This bug is an example of
that. It was present in nebula in revisions up to 142bbd8 included. To
explain this bug, I must explain a little bit how nebula was written. One of
the first goals was to keep it clean, which means avoid redundant code.
If you look at the opcode table in the CB table, there are 3 instructions
that do things with a very similar API: res, set and bit. They all take a
register, a bit, do something on it and we are good. There is also the version
with %hl dereference. This gives a great opportunity to write a proxy with the
basic operations of reading and writing the registers/memory, and the specific
function to do just what it’s supposed to do: set, reset or test a bit in the
value. But the bit function doesn’t need to modify the value, and I said:
whatever, we will just write back the unmodified value to the registers/memory
and this will be good, no need for a separate function.
Few weeks/months later, the emulator is a going well and now implements a lot
more features, including the graphical emulation and some memory banks
controllers, but when launching some games, for example Kirby, it would crash
with the error Unknown opcodes E3.... Did we end up in some shady memory part,
say data? Lets check what the graphs look like.


This time, the working emulator was not really necessary, anyway seeing its
graph gives a good insight. Lets start where the emulator crashed, in function
sub_40E4.
The interesting thing is both graph differ when they start executing memory in
switchable memory bank. This is an information we did not have, and which is
really interesting. So I started to log when bank switches where done, but
without the informations available in the graphs, there would be too much. Using
the linear log, I went to the crash point, and searched backward for bank
changes. One happens in the function sub_19F9 linked bellow, and called just
before the CPU starts executing wrong memory. The guilty instruction is bit $3,
(%hl) in local block loc_1A6E.

This behavior was not expected when I first wrote the CPU. Indeed, memory
banking was an unknown concept to me and I did not expect that writing the same
value I just read to a memory position could have side-effects like that at the
time. Here bracoujl was used with another type of log, to first understand and
target what was going on, and then understand the second type of log, which made
the debugging a lot easier and faster.
Conclusion
This project was really interesting. The material to test was really diverse,
and doing that kind of work raises a lot of interesting corner cases. It also
taught me that trusting your debugger is “dangerous” and also really important.
Indeed when trying to find a bug, assumptions will be made based on the
information taken form the debugger. This project taught me that when writing a
debugger, a lot of care must be put into it, so that then when you use it, you
can make your assumptions safely. Obviously, there is no warranty bracoujl is
perfect, but it works correctly :P.
You should have no hard-time trying it
And if you do, bug me! Again, everything is available on my github. If
you want to try it on another architecture, just take the z80 configuration
(disassembler is optional), adapt it to your architecture and try to run it. You
can even send me a mail and I will be happy to help you with that.
What next?
Missing features
Even though my nebula project is in pause for me, which means bracoujl too,
but this does not mean that it will never see new features. Some of the things
that could be enhanced are:
- Adding serialization of graphs. This cannot be done with pickle trivially since there is a circular dependency right now between the blocks and the links. But it must be possible easily anyway, by either removing the circular dependency (not sure if possible) or simplifying one of the references. It would be awesome speed-wise. Graphs are currently generated from logs each time svgs, dots or comparison is done.
- Add a search feature, that gives information, like the local block in which
a particular instruction is, or it’s position in the image (see next point).
If you really need searching feature now,
grepis still cool. - Maybe something other than
graphvizwould be cool to generate the graphs. Sometimes the results are a little weird, nothing too bad though. - Being able to have information on the time-line, and put annotations to the graph, could be cool :)
- Bugfix: Compress nop-sleds (as seen in the graph the “wrong-size” part, where I had to fix them by hand so that they are not too huge.
New project idea
To conclude, this project gave some of my friends and me a fun idea: why not try to infer an instruction set from its behavior? Say you start to reverse engineer a virtual machine for an unknown architecture, it could be fun to work on some tool that would give insight by observing the behavior of it executing code. I don’t know how far this idea could go, but I may work on that some time soon.
Enjoy Reading This Article?
Here are some more articles you might like to read next: